


XPS Network and KINEXON Sports announce new API integration
A new connection brings KINEXON Sports player-tracking data into customizable XPS Reports, allowing coaches, performance staff and sports directors...
Read More
July 8, 2026
11 min reading
Collecting athlete data has never been easier. GPS systems, force plates, wellness questionnaires, heart rate monitors, and wearable technology now generate an enormous amount of information every day.
The challenge isn’t collecting more data, it’s knowing when a change actually matters.
Sport scientists rely on a handful of proven methods to tell whether a change in performance reflects normal day-to-day variation or genuine, meaningful adaptation: percentage change, Z-scores, the Smallest Worthwhile Change (SWC), and the Acute:Chronic Workload Ratio (ACWR).
Rather than leaning on any single metric, the most effective athlete monitoring systems combine these methods with workload, recovery, wellness, and coaching observations, turning that insight into better coaching decisions.
Athlete monitoring is the systematic process of collecting and interpreting performance, workload, recovery, and wellness data to support coaching decisions.
Rather than relying on intuition alone, coaches and practitioners use objective information to answer important questions:
The primary goal isn’t to collect more data. It’s to reduce uncertainty and make better decisions.
No single monitoring metric answers every question. Each tool provides a different perspective on athlete performance. Direct comparisons tell us whether something has changed, Z-scores indicate whether the change is unusual, the Smallest Worthwhile Change (SWC) helps determine whether it is practically meaningful, and the Acute:Chronic Workload Ratio (ACWR) provides context by comparing recent training with an athlete’s longer-term workload.
When used together, these methods help practitioners interpret data more confidently and make better-informed coaching decisions.
The simplest way to monitor athlete performance is by comparing today’s results with previous measurements. Coaches often express these differences as absolute values or percentage changes, making this one of the quickest and easiest monitoring methods to interpret.
Percentage change provides an immediate snapshot of whether performance is improving, declining, or remaining stable. However, it doesn’t indicate whether that change is meaningful or simply reflects normal day-to-day variation.
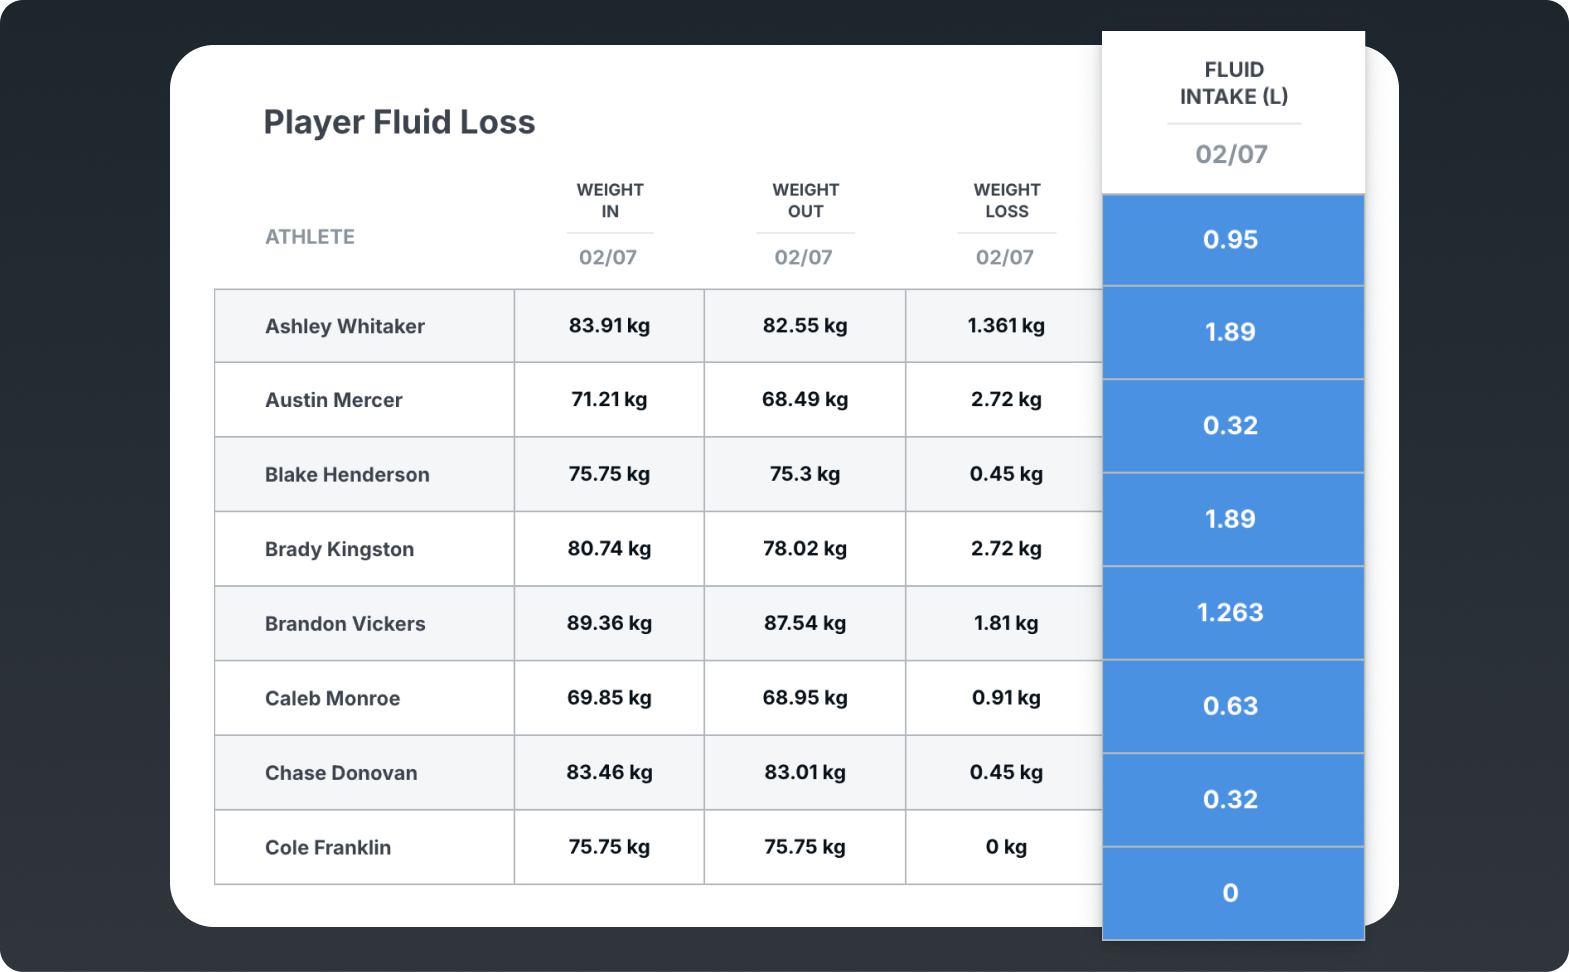
For example, consider hydration after competition.
According to the American College of Sports Medicine’s Position Stand on Exercise and Fluid Replacement, body mass loss during exercise provides a practical estimate of fluid loss.
If a player loses 1.4 kg of body mass during a match, this roughly corresponds to 1.4 litres of fluid loss. Rather than giving every athlete identical hydration advice, practitioners can individualise recovery recommendations based on each player’s specific needs.
This simplicity is why percentage change remains one of the most widely used methods in sports science. It is quick to calculate, easy to interpret, and immediately actionable.
However, it also has an important limitation.
Athletes naturally fluctuate from day to day. Sleep quality, travel, accumulated training load, nutrition, stress, illness, and environmental conditions can all influence performance. A 5% decrease may initially appear concerning, yet still fall well within an athlete’s normal range.
Without additional context, normal variation can easily be mistaken for meaningful adaptation or unnecessary concern.
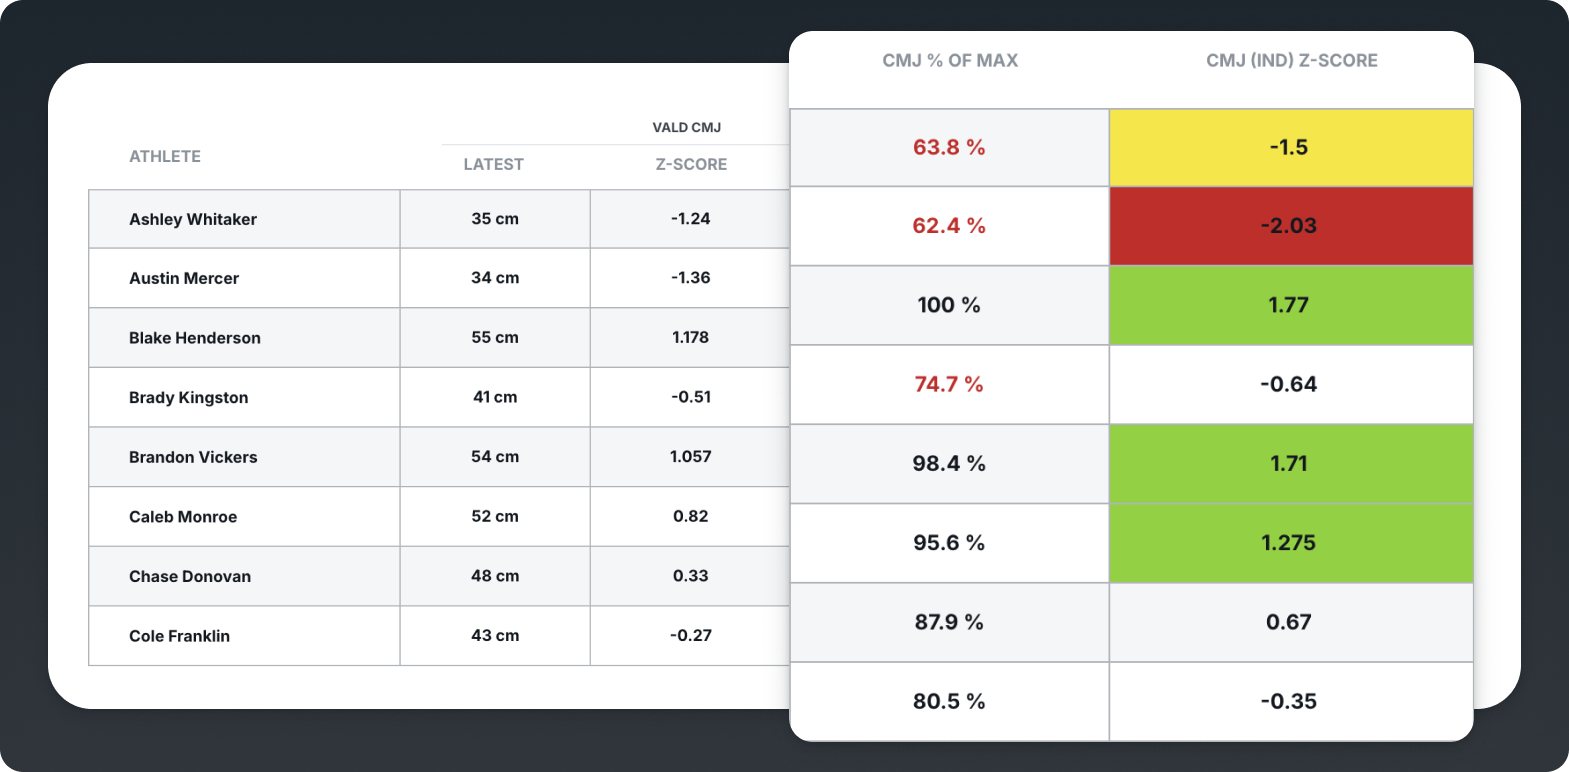
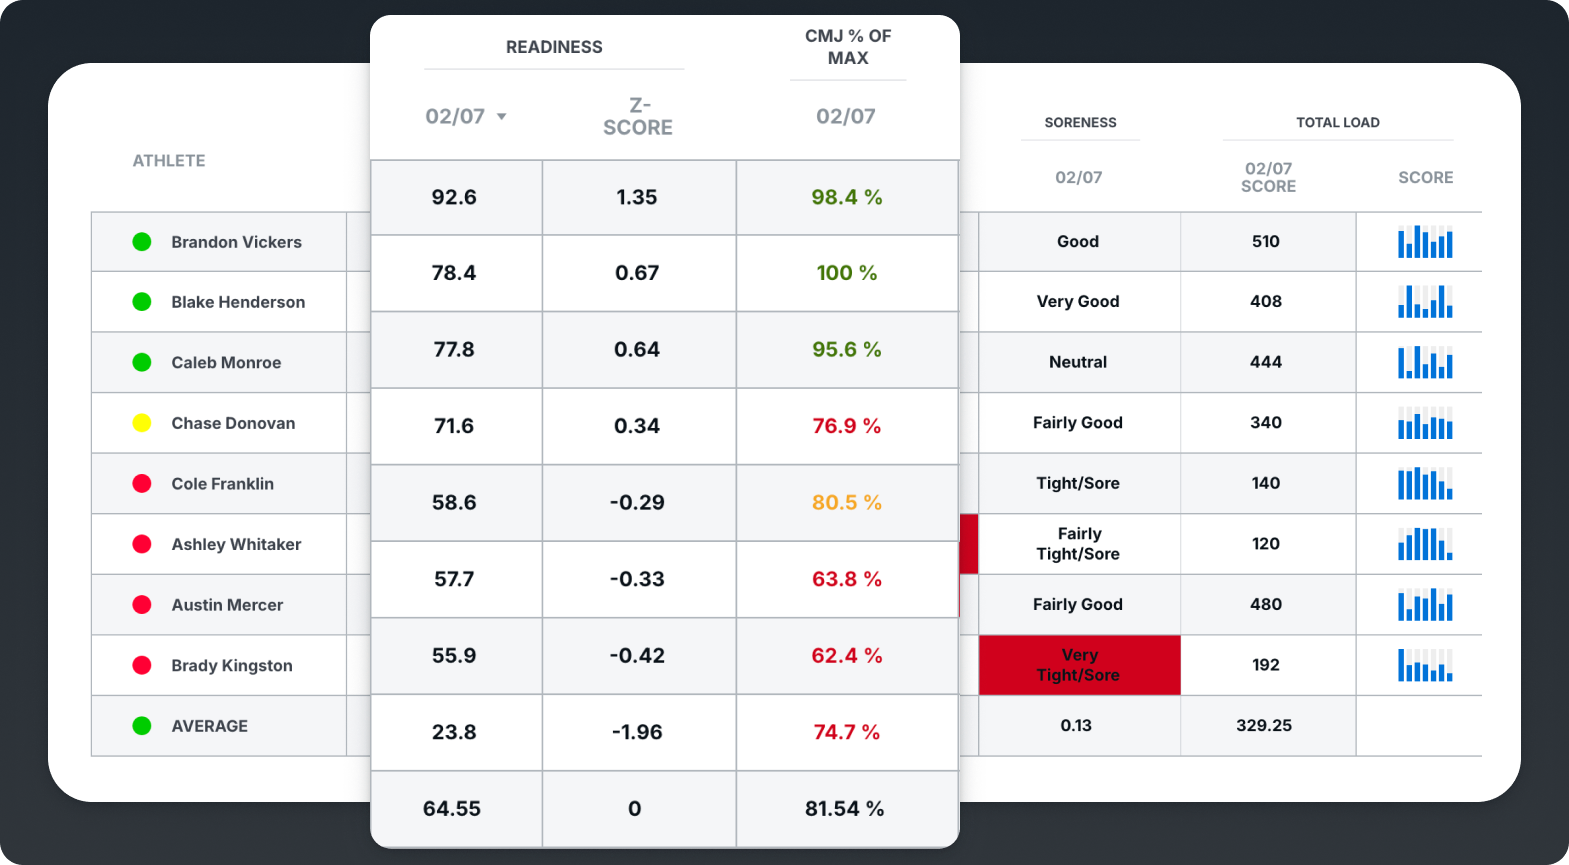
A Z-score compares today’s performance with an athlete’s historical average while accounting for their normal day-to-day variability. Instead of focusing only on the size of a change, it measures how unusual today’s result is for that individual athlete.

This is particularly valuable because every athlete demonstrates different levels of consistency. Some fluctuate considerably between sessions, while others remain remarkably stable. Z-scores account for these individual differences, allowing practitioners to compare performances on a common scale.
Rather than simply asking: “Has performance changed?”
Z-scores ask: “Is today’s performance unusual for this athlete?”
Imagine an athlete whose average countermovement jump is 42 cm, with a standard deviation of 1.5 cm.
If today’s jump measures 39 cm, the resulting Z-score is −2 (Sanders et al., 2026).
This means today’s performance sits two standard deviations below the athlete’s typical level, a result that would generally be considered a meaningful deviation from their normal performance.
Importantly, a Z-score doesn’t provide the answer, it starts the conversation.
Practitioners can begin asking questions such as:
Rather than relying on arbitrary thresholds, Z-scores help practitioners interpret performance relative to each athlete’s own history, making them one of the most valuable tools in athlete readiness monitoring.
The Smallest Worthwhile Change (SWC) represents the minimum improvement or decline in performance that is considered practically meaningful rather than normal biological variation or measurement noise.
A commonly used calculation is:

Unlike a Z-score, which tells us whether today’s result is unusual, SWC helps determine whether the magnitude of change is meaningful from a coaching perspective.
For example, imagine the SWC for a sprint test is 0.03 seconds.
An improvement of 0.01 seconds is likely to reflect normal variation.
An improvement of 0.05 seconds, however, is much more likely to represent a meaningful adaptation that could influence performance.
SWC helps practitioners avoid overreacting to trivial changes while recognising improvements that genuinely matter.
Like every monitoring tool, however, it also has limitations.
Because SWC is often calculated using group data, it may not fully reflect individual athlete variability. It also doesn’t account for measurement error unless combined with reliability statistics.
For this reason, experienced sport scientists rarely use SWC in isolation. Instead, it forms one part of a broader decision-making framework that includes performance testing, workload monitoring, recovery data, and coaching observations.
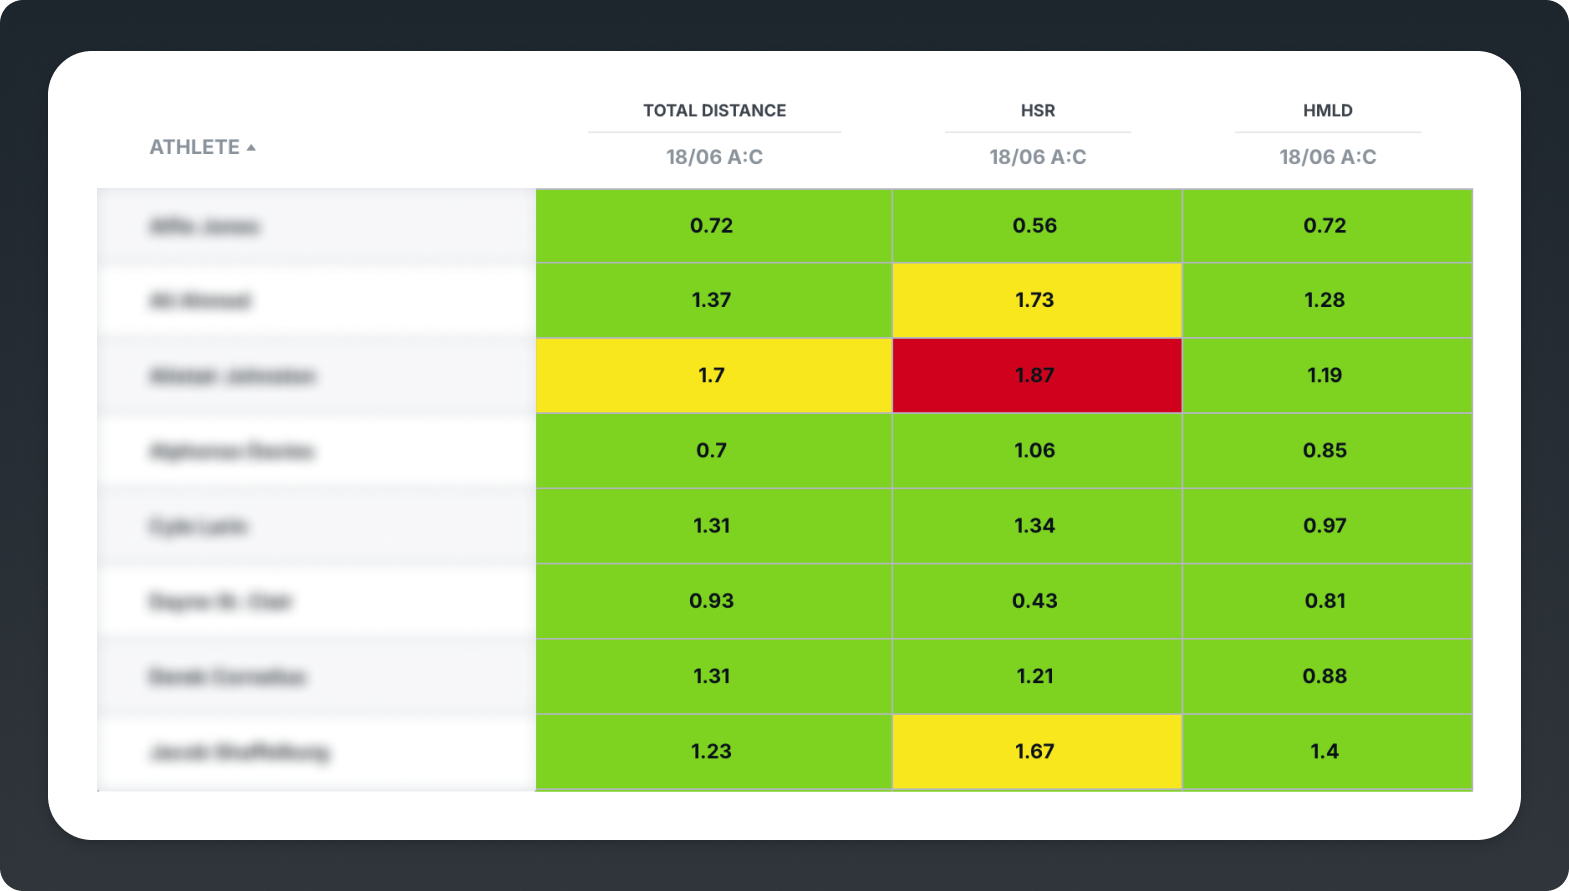
The Acute:Chronic Workload Ratio (ACWR) compares an athlete’s recent training load with the workload they have been exposed to over a longer period (Bowen et al., 2017). It helps coaches understand whether recent training represents a normal progression, a sudden spike, or a reduction in workload.
A commonly used calculation is:

By comparing short-term workload (acute load) with longer-term workload (chronic load), practitioners can identify whether an athlete is experiencing a rapid increase, decrease, or stable progression in training demand.
Rather than serving as a predictor of injury, the ratio provides valuable context for interpreting changes in performance, fatigue, and recovery.
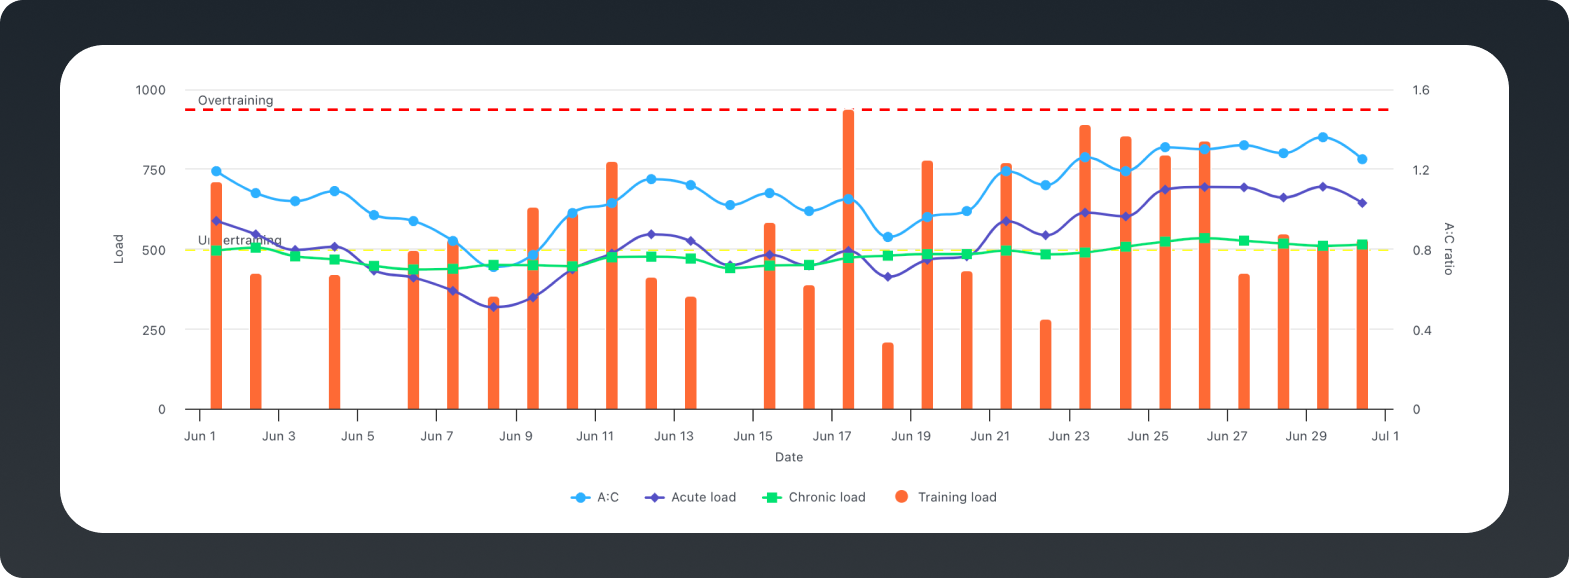
For example, imagine an athlete who typically completes 24 km of running each week but accumulates 33 km during their most recent week. Their Acute:Chronic Workload Ratio would increase to 1.38, indicating a substantial increase in workload compared with what the athlete has recently been accustomed to.
If performance decreases while workload increases, practitioners have additional information to help explain what they’re observing. When combined with soreness scores, wellness questionnaires, sleep quality, and performance testing, training load becomes far more meaningful than when viewed in isolation.
Like every monitoring metric, ACWR should never be interpreted on its own. It is most valuable when considered alongside other athlete monitoring data and coaching observations.
The most effective athlete monitoring systems don’t rely on a single metric. Instead, they combine multiple sources of information to reduce uncertainty and provide a more complete picture of athlete readiness.
A typical monitoring workflow looks like this:
1. Collect reliable data using tools such as GPS, force plates, wellness questionnaires, heart rate monitors, and performance tests.
2. Compare current results with each athlete’s historical performance.
3. Use Z-scores to determine whether today’s performance falls outside the athlete’s normal range.
4. Use the Smallest Worthwhile Change (SWC) to assess whether changes are practically meaningful.
5. Interpret performance alongside training load, recovery, soreness, sleep quality, wellness data, and coaching observations.
6. Make informed decisions about training, recovery, competition, or further investigation.
Following this process transforms isolated numbers into meaningful coaching insights.
No single monitoring metric tells the whole story.
A decrease in countermovement jump performance may simply reflect normal day-to-day variation.
However, imagine that same athlete also demonstrates:
Viewed individually, none of these metrics necessarily tells coaches what action to take.
Viewed together, they provide a much clearer picture of the athlete’s current readiness.
This is where sports science creates real value.
The goal isn’t to predict injuries or eliminate uncertainty completely. It’s to combine multiple sources of information, reduce uncertainty, and support better coaching decisions.
Each method answers a different performance question. While they are often used together, each has its own strengths and limitations. The comparison below provides a quick overview of when each approach is most useful and what to consider when interpreting the results.
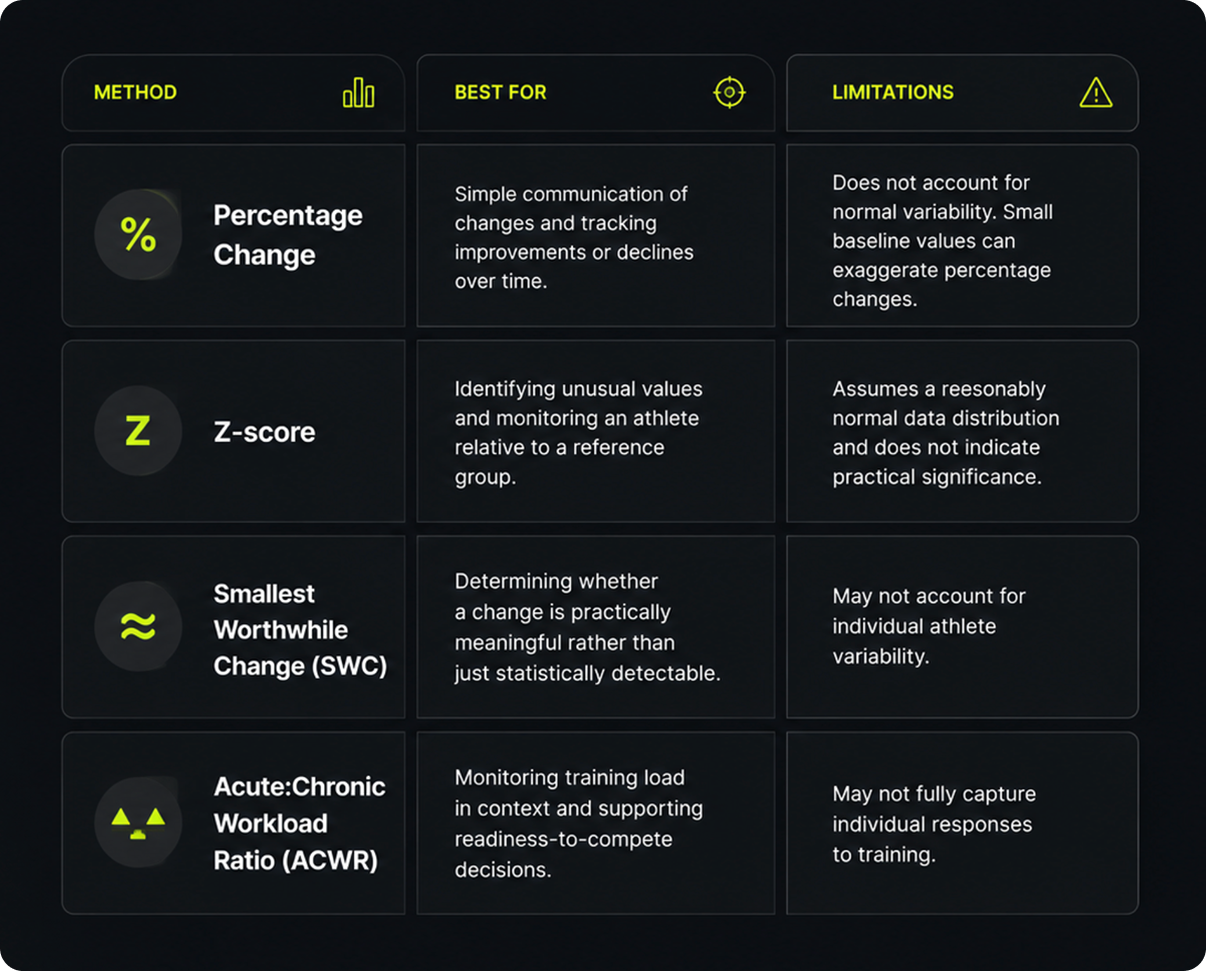
Rather than relying on a single metric, the most effective athlete monitoring systems combine these methods with workload data, recovery metrics, wellness questionnaires, and coaching observations. Together, they provide the context needed to identify meaningful changes and support better decision-making.
Athlete monitoring is the systematic collection and interpretation of performance, workload, recovery, and wellness data to help coaches make informed training decisions and better understand how athletes respond to training.
A Z-score compares an athlete’s current performance with their historical average while accounting for normal day-to-day variability. It helps identify whether today’s result is unusually high or low for that individual athlete.
The Smallest Worthwhile Change (SWC) is the minimum improvement or decline in performance that is considered practically meaningful rather than normal biological variation or measurement noise.
The Acute:Chronic Workload Ratio compares an athlete’s recent training load with their longer-term workload. It provides context for interpreting changes in fatigue, recovery, and performance but should not be used as a standalone predictor of injury.
Sport scientists combine several methods, including percentage change, Z-scores, the Smallest Worthwhile Change (SWC), training load metrics, and coaching observations. Looking at multiple signals together provides a more accurate understanding than relying on any single metric.
Common athlete monitoring metrics include performance tests such as countermovement jumps, GPS-derived training load, wellness questionnaires, heart rate data, force plate testing, sprint performance, Z-scores, SWC, and workload measures such as the Acute:Chronic Workload Ratio.
The purpose of athlete monitoring isn’t to collect more data. It’s to make better decisions.
Every measurement – whether it comes from GPS, force plate testing, wellness questionnaires, heart rate monitoring, or training load – is simply another piece of the puzzle.
The most effective sport scientists don’t search for a single metric that explains everything. Instead, they combine multiple signals, interpret them within the athlete’s unique context, and act when meaningful changes emerge.
Performance isn’t driven by numbers alone. It’s driven by the quality of the decisions those numbers support.
Watch the XPS Webinar below and learn how to turn information into action. For more content like this, visit XPS Academy.
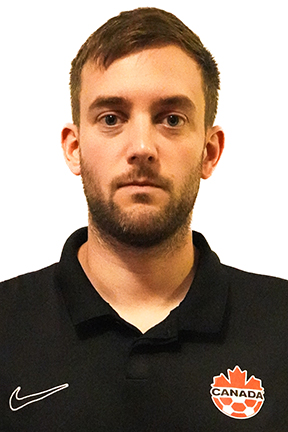
Félix Sauvestre | Sport Science Coach | Canada Soccer
Félix is a Sport Science Coach with over 8 years of experience in professional and developmental football. He currently serves as Performance and Sport Science Manager for Canada Soccer’s Youth Men’s National Team and works with the Institut National du sport du Québec. Previously, he led strength and conditioning and sport science programs at Soccer Québec and CF Montréal’s academy, specializing in athlete monitoring, workload management, and injury prevention.

A new connection brings KINEXON Sports player-tracking data into customizable XPS Reports, allowing coaches, performance staff and sports directors...
Read More
This past weekend, our global sales team came together in Belgrade, Serbia for several inspiring days of conversation, collaboration...
Read More
We are excited to release Posts, a highly requested feature which is essentially a shared feed inside your XPS...
Read MoreThank you!
Our representative will get back to you soon with time suggestions for an online meeting.
If you have any questions contact us at support@sidelinesports.com
Schedule a short online meeting with our representative
Try free XPS 14-days trial right now No credit card required


